

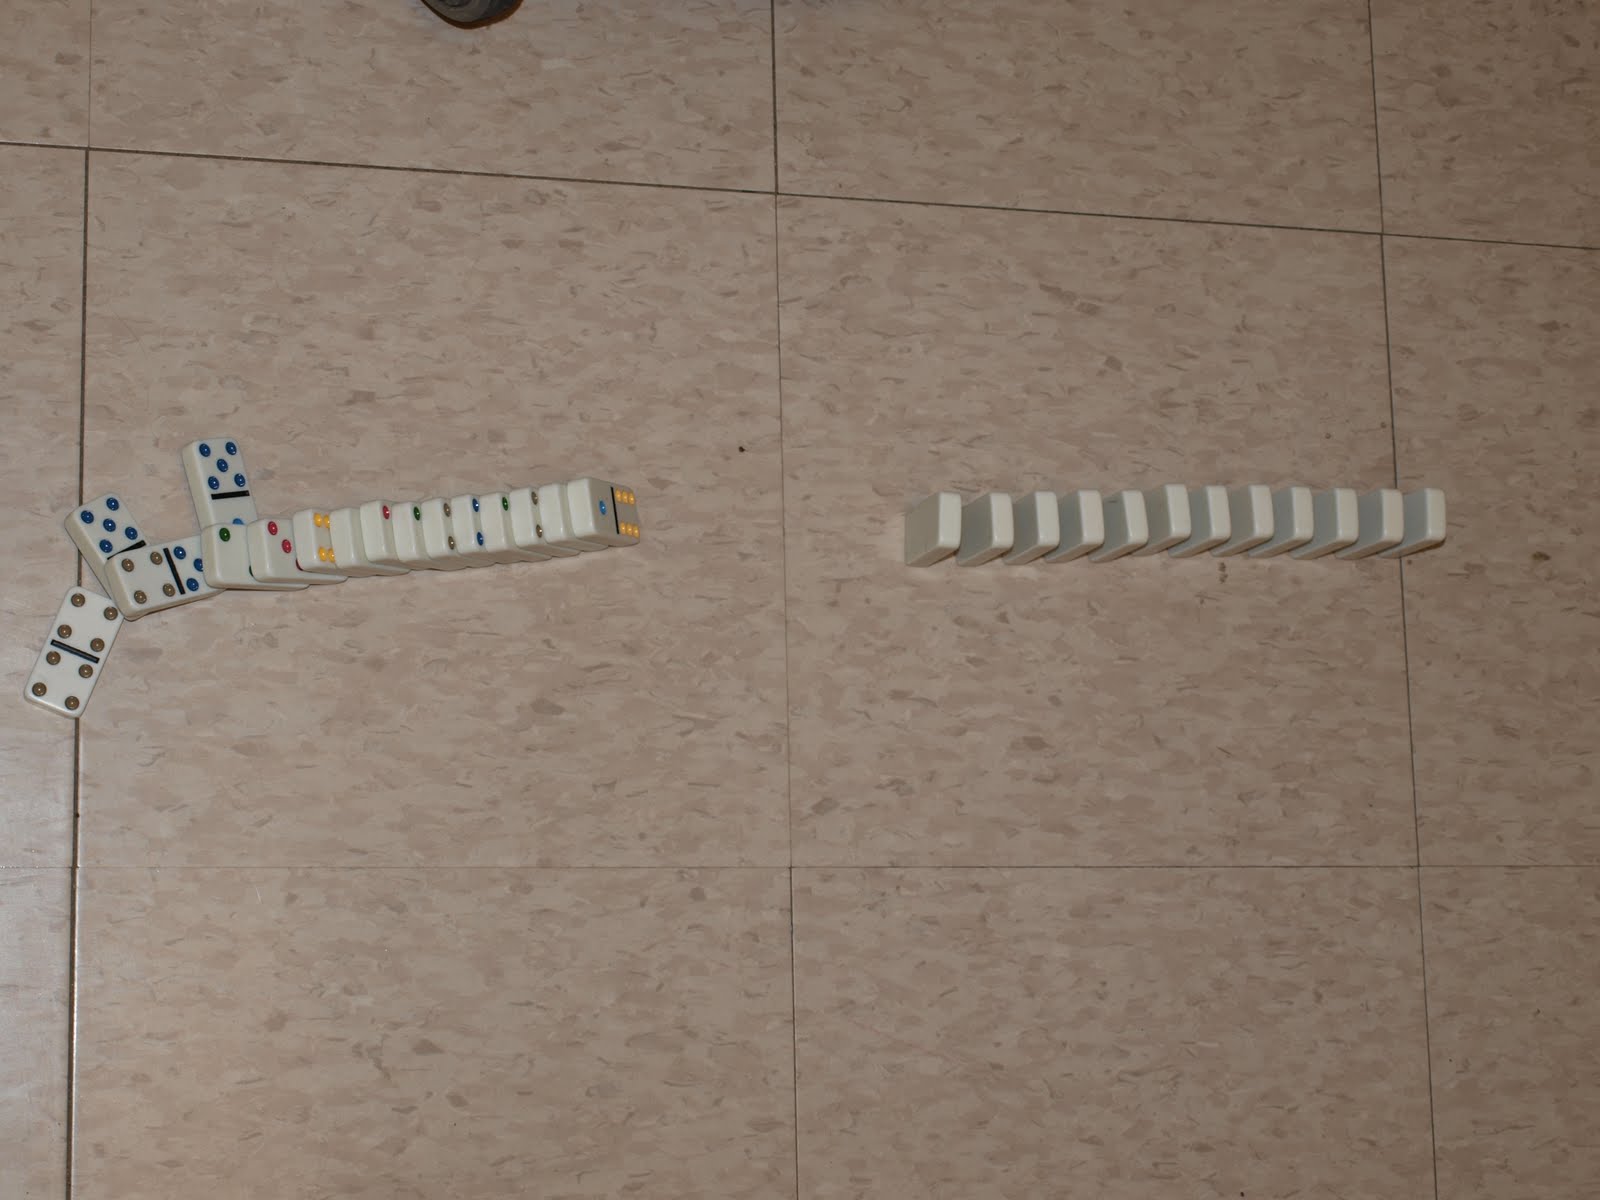
On March 3-4, Mrs. Cureton's freshman Physics classes practiced graphing by plotting the speed of falling dominoes. Students placed the dominoes different distances apart (close, medium, far), measured the length of the line, and then toppled them while timing the result.
A bar graph was used to interpret the data. Speed, the dependent variable in this activity, was displayed on the y-axis (vertical). The independent variable, the distance apart of the dominoes, was displayed on the x-axis (horizontal).

Some groups discovered that closely-spaced dominoes fell faster, and some groups found that farther-spaced dominoes fell faster. In a perfect experiment, under controlled conditions, there is an optimal distance of 2 cm at which a straight line of dominoes falls the fastest. More closely spaced dominoes fall slower because it takes them longer to fall over, and more distantly spaced dominoes fall slower because it takes them longer to hit the next domino.
If you want to study this phenomenon in detail, check this out. Or for a little bit simpler version, look here. In our class, we did not measure the spacing between dominoes. Mrs. Cureton has found that procedure to be too time-consuming for the classroom.
Students also discovered which members of the group had a steady hand for setting up dominoes. Some found this out the hard way!

Likewise, they found out who had a quick thumb on the stopwatch...or better yet, who actually remembered to hit the button when the dominoes were toppled.

Don't bother crying over toppled dominoes! The only solution is to set them up and knock them down again. Remember to time it!
After a long two days of dominoes, Mrs. Cureton saw them everywhere. She even imagined them hanging from the ceiling.

It's a good thing she has 365 days to recover before her classes topple dominoes again.
No comments:
Post a Comment